Benchmarking and profiling data: two takes
After working on a personal project that took in a lot of data, to the tune of a fraction of the human genome, I inherited a Turing brown field project that has been worked on by various groups of students in an iterative fashion. It had accumulated several thousand database records linking various jobs with their respective companies and locations and we realized we were trying to answer questions about how much chronological data we could query at a time without knowing how slow those queries actually were.
Enter benchmarking and profiling performance data. While benchmarking could be described as simple speed (or memory) measurements, profiling compares these measurements in the context of a typical user flow, pointing to where bottlenecks might be and thus allows a developer to prioritize rather than micro-optimize.
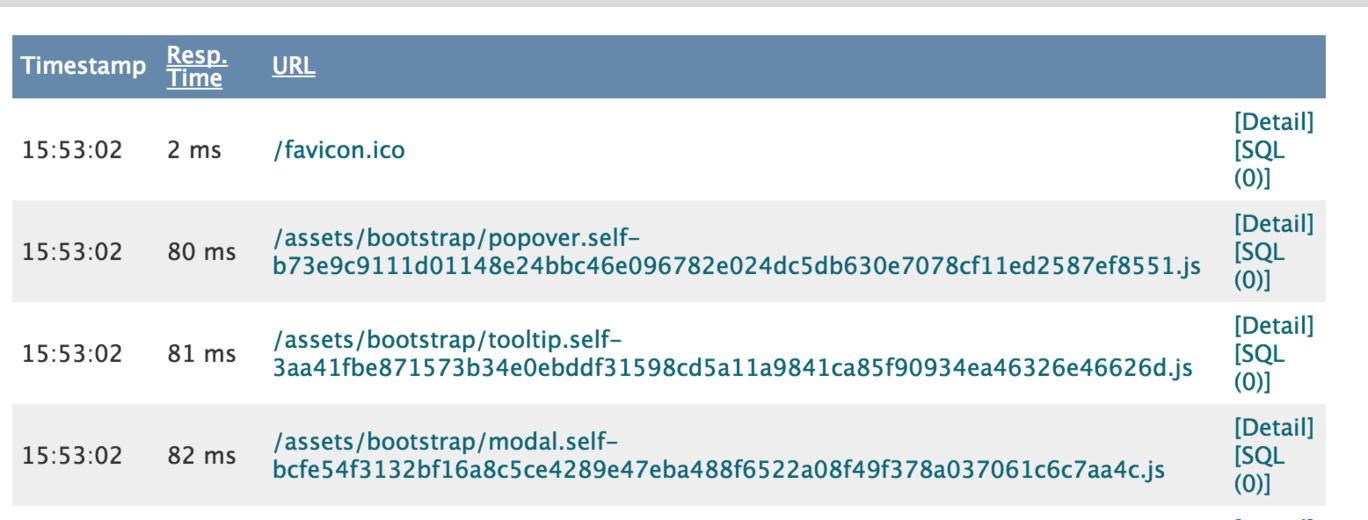
Should our API serve one month of data? Two months? We were asking questions in the wrong order. So one of my first tasks on this team became researching how we might profile our web app. We did have New Relic set up and I spent some time that and Skylight, other people have written about the distinction, and I’d rather dig into some code! I’ll show you a variant on Rails performance testing that I tried, as well as what I eventually opted to use, a rake task in combination with logging to generate data in development.
With the release of Rails 4, performance testing was moved to the gem perftest. By default, perftest gives you access to tests which can both benchmark and profile and tweaks a few config settings from the usual test environment, including caching. It simulates a production environment running against your test database.
However, my orders from high, i.e., my instructor, were to run perf tests against a seeded database of ~20000 records. How could I possibly load so much data in a test environment, only to have it wiped each time I ran tests?
Solution 1: Rails perf tests in a custom environment
The answer was, no, I couldn’t fully simulate a production database in my normal test suite. My initial solution was to implement a custom testing environment, as detailed in this blog post.
This strategy goes even further than perftest in reimplementing a production-styled environment, but instantiates a new one (call it the benchmark environment, if you will). This allows one to seed a database with massive amounts of data, use custom production-like environment variables, and keep all this contained.
The steps of my implementation were:
-
Config
database.ymlwith a new setup. I pointed it at my development database. -
Add a new config file in
/config/environmentsfor your new environment. While this would depend on your production config, you would try to mirror that config closely. -
Set up the
perftestconfig in a helper file -
Start writing performance tests! This should and will look almost like a feature test, other than you won’t be asserting what’s on the page, but you will be hitting endpoints of note and following your users’ likely workflows through your app.
-
Create a rake task. As the original blog post points out, this removes the db:test:prepare step that would otherwise reset your database.
-
Run the tests and enjoy the data provided to you by
perftest’s logging.
While this was a decent solution and logical, I got my tests written and all my config set up, and as I attempted to debug why I seemingly was in the correct environment and database both, but didn’t have my database data, I realized this solution was overly complex. It was taking a solution that was supposed to be standalone, and added another layer.
Solution 2: Use the tools we already have, but let’s make more data
While I realized there were numerous solutions to this problem, all probably useful and feasible, I turned to an instructor who had solved similar problems while at LivingSocial. He suggested I implement a rake task that automates hitting endpoints of my own definition, similar to how a performance test would be written.
While I chose to seed a development database and hit that, you can conceive of other configs that would more closely approximate a production environment. I chose my solution primarily to allow teammates to test new queries before pushing to master.
- Use Capybara to describe a common user story, then log the data with Rails logger. Capybara can be used to just create a session. I then described common user stories:
session.all("h4").sample.click_link_or_button("View Listing")
-
Include benchmarking methods to log data automatically, and a rake task to randomly hit all my methods as much as I wanted it too.
-
Create a whole lot of realistic data (or use real data) in a development database. Having now seeded two large databases, I have ideas on how to do this well, but that can be another blog post!
-
Turn back to your profiling gems like New Relic. As much as I like their dashboard for deployed websites, installing the gem also gives access to an endpoint on your local app at
/newrelic. While the visualizations are a little different, generating a lot of hits with my rake task also provided a lot of New Relic analytics while in development.
Unfortunately, as our web app is still young, our crazier database queries remain to be written, so I don’t have fun profiling I can do yet. However, having a means to monitor these queries ahead of time means that future developers can stay one step ahead and always know where their biggest performance expenses exist.
Tomorrow I’ll be headed to a local Ruby meetup where the speaker will be addressing this very topic, so I look forward to seeing what assumptions I got wrong… stay tuned.